OpenJTAG and OpenOCD under Eclipse
I bought from soliddepot.com an item named Spruce -SolidDigi STM32 Arduino Compatible Board With LCD
And then I tried to debug the board under Eclipse!
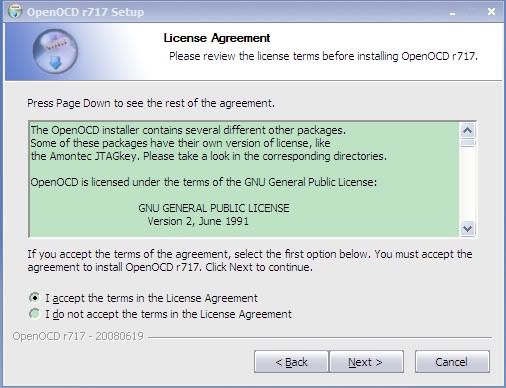
1. Install OpenOCD
Next
Next, unselect “Add the make utils to the PATH variable” under “Make utils”:
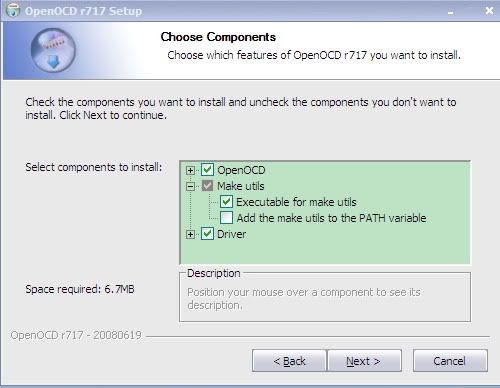
Click “next” to continue until finish the installation.
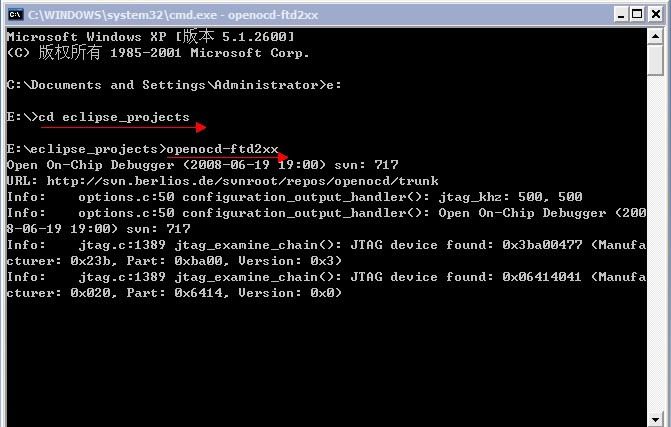
2. Download in command line mode:Copy openocd.cfg to directory “eclipse_projects”.Connect openjtag to the Spruce, and in command line run:
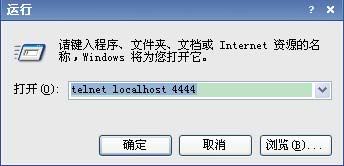
Next “telnet localhost 4444”Type the following command:
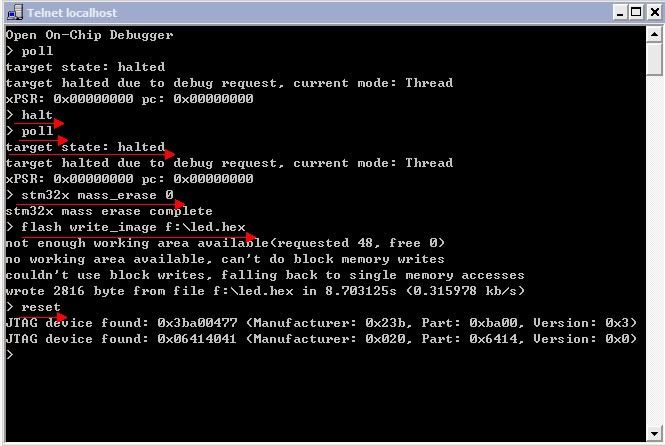
Poll: poll spruce status
Halt:stop the spruce board
Stm32x mass_erase 0: mass erase flash
Flash write_image hex with file full path: write program to flash
Reset: reset the spruce
Note: stop the development board, mass erase, and then write the program to flash.
3. Download and debug under Eclipse:
3.1 Configure the connection of Openocd
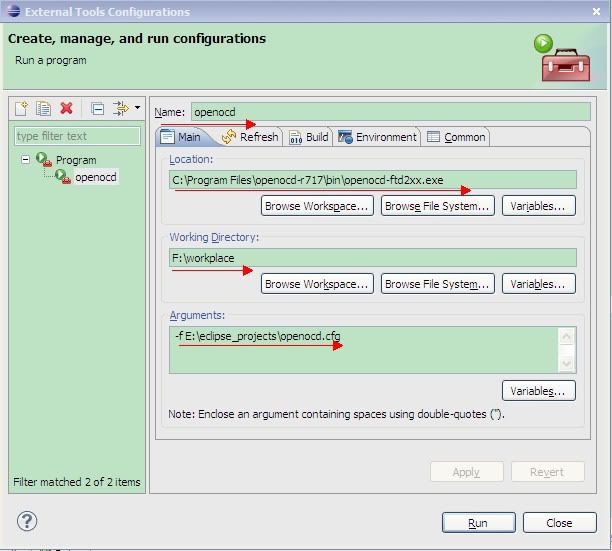
In menu, Run->External tools->External tools Configurations
Click the following in sequence, Name、Location、Working Directory and thenArguments, click apply
Name openocd
Location openocd-ftd2xx.ex’s full path
Working Directory workspac’s full path
Arguments -f openocd.cfg’s full path
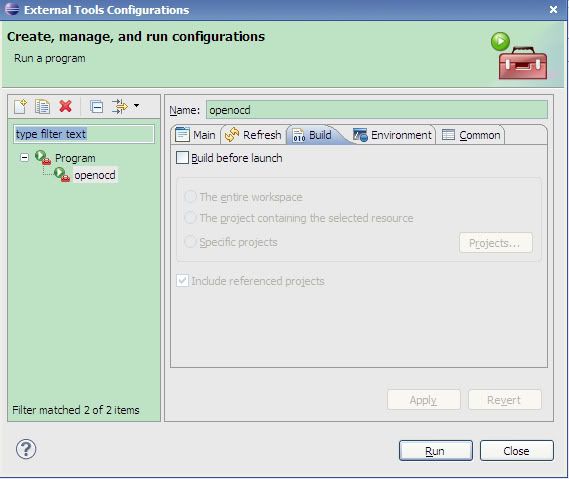
Open Build options, remove “Build before launch” and click “apply”
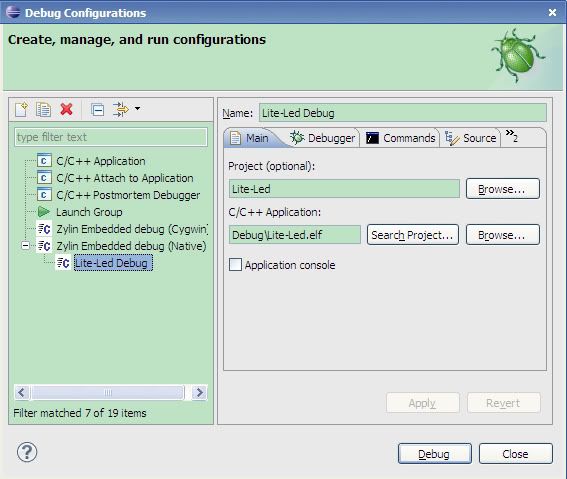
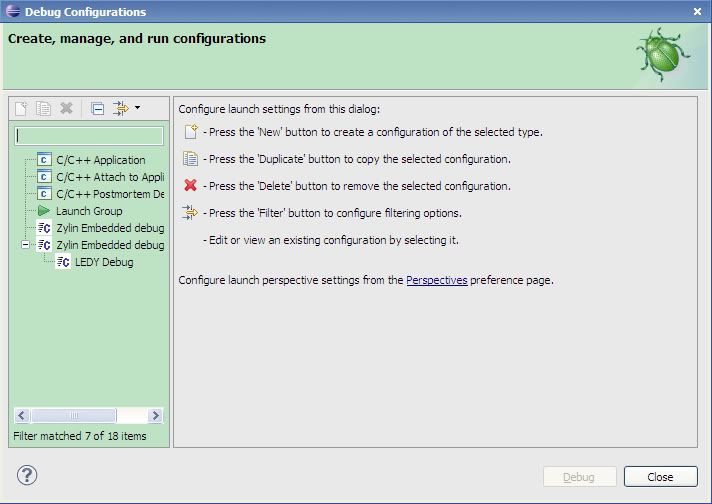
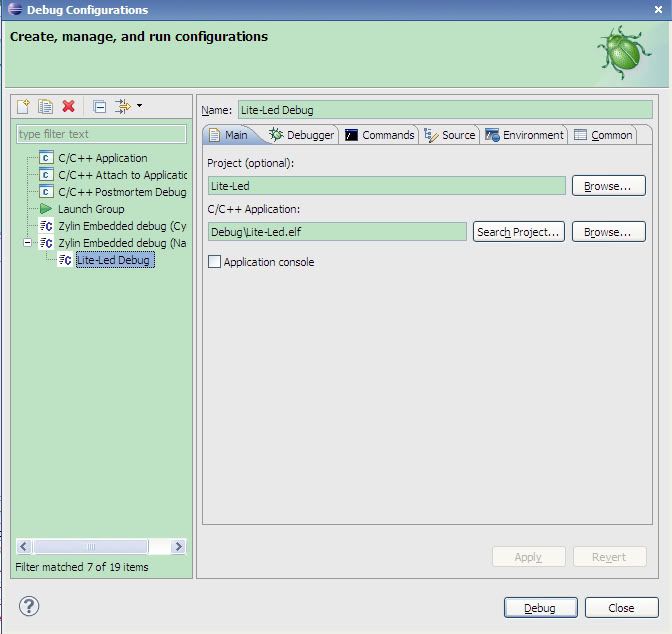
3.2 Debug configuration:Click the project name ->Run->debug configuration->double click Zylin Embeddeddebug(Native), the following window will show up
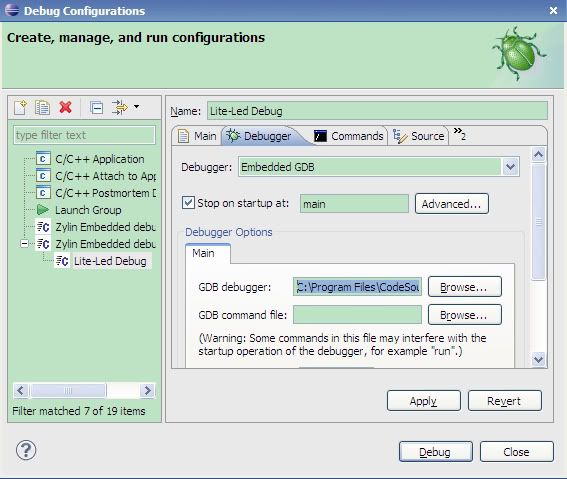
Select “Debugger” and add location of the debug tool: CodeSourcery->SourceryG++ Lite->bin->arm-none-eabi-gdb.exe.(Default: C:\Program Files\CodeSourcery\Sourcery G++Lite\bin\arm-none-eabi-gdb.exe)
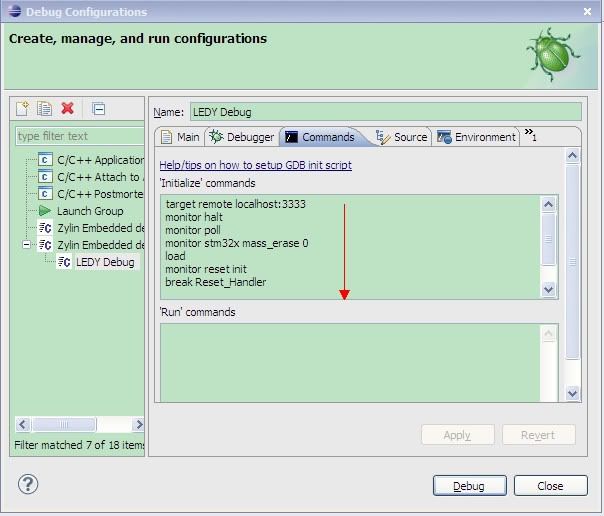
Open “Commands” option and add the following commands:
target remote localhost:3333
monitor halt
monitor poll
monitor stm32x mass_erase 0
load
monitor reset init
break Reset_Handler
break main
continue
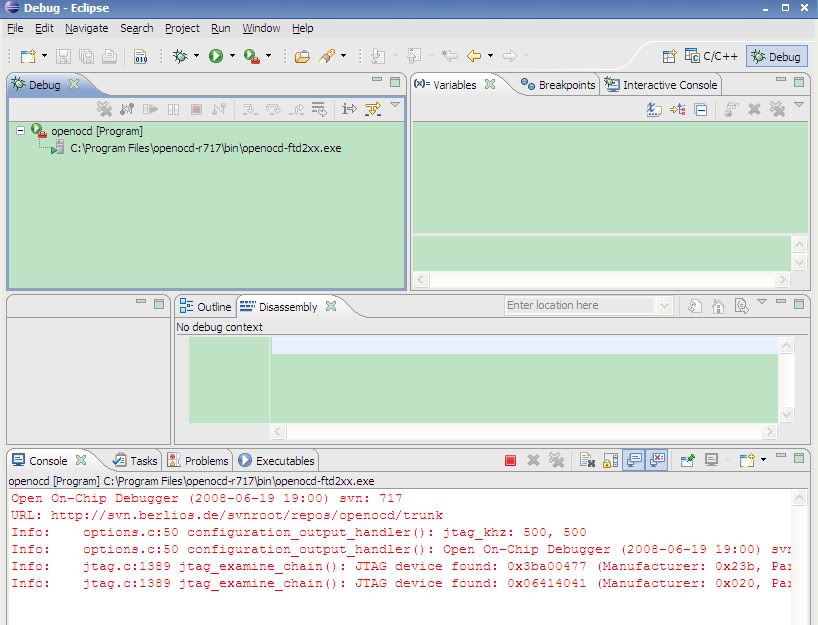
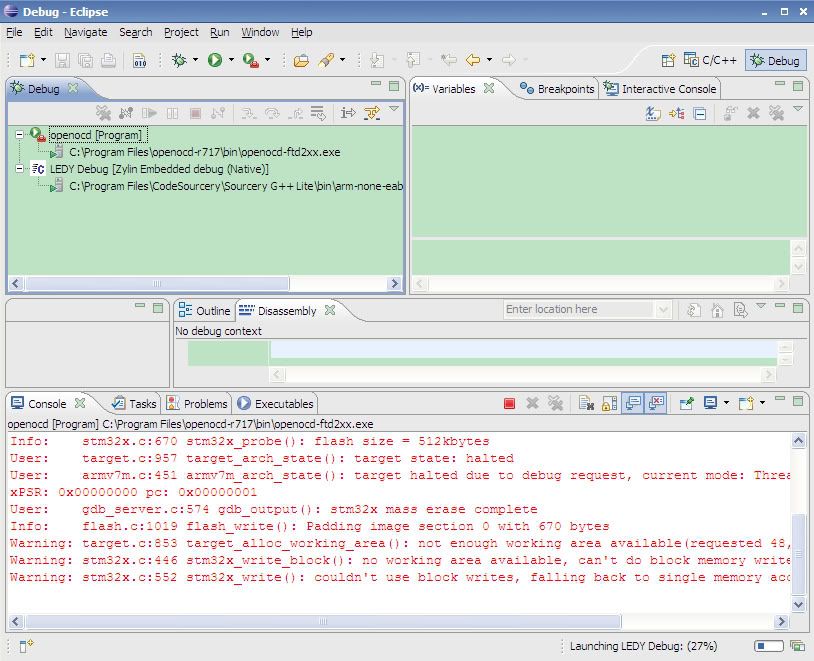
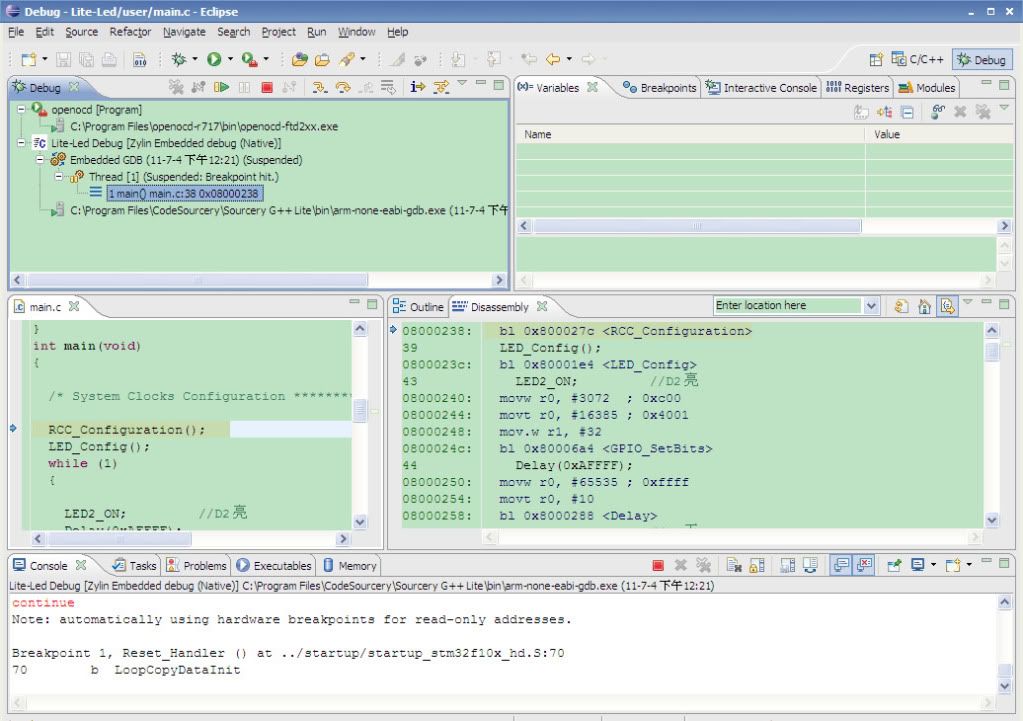
4. Download and debugClick Debug button in eclipse to enter into debug panel, click to openopenocd,and the following information will show up when connected to openjtag:
Click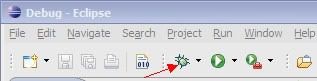 and select “DebugConfiguration”
Select the file to be debug, and single click “Debug” to begin debug.
Waiting for the program to be downloaded to spruce:
After downloading, click to run the program, and single click
 or F5to single step debug.
We can double click to set breakpoints and debug.
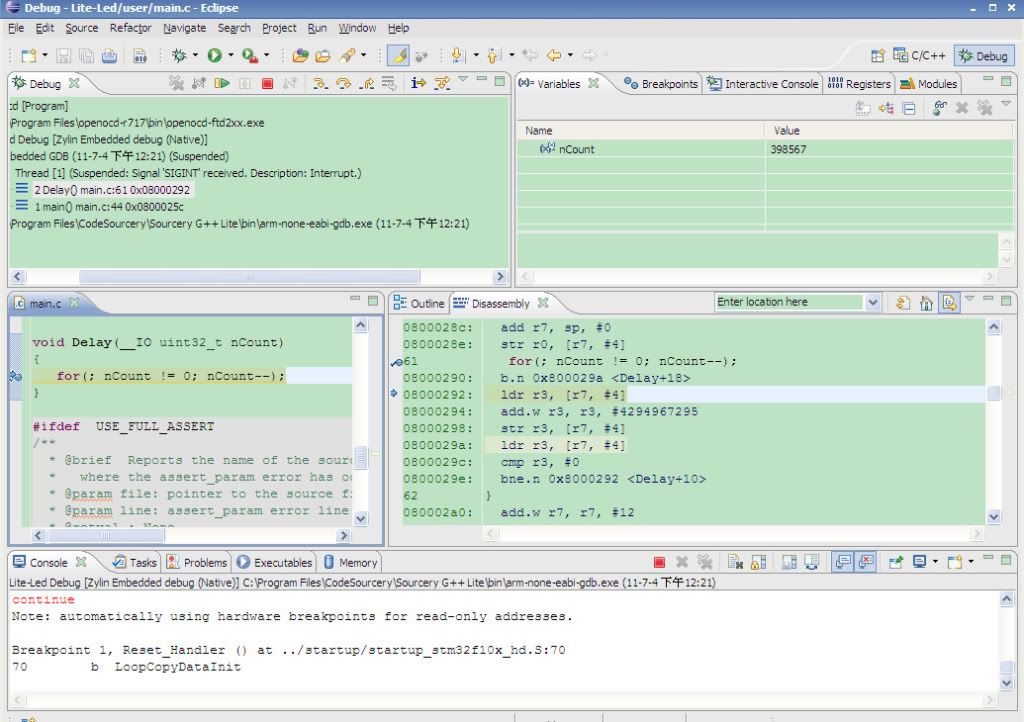
Isn't it nice!